Every summer is the same thing. We are always hearing the earth is hotter; or that we have reached record temperatures.
In Augusta, summers are almost always the same. Humid and super hot. Just about every year, I have this feeling that I’m dying and the temperatures were insanely hot.
Most days, I come home from work to see the temperatures are rarely at what they are set in the thermostat. In July, I completely avoid cooking because it makes the house even hotter.
This year felt a little different. Not as hot.
Some evenings, I even enjoyed sitting outside watching the sunset. That never happens in July.
That made me wonder if this year has been cooler than others. I decided to use my data science skills to determine, without a doubt, how this year has been faring.
The Data
The first step was to collect the data. I had once done a project for my PhD and remembered that I could get the data from Open Meteo. The site provides historical weather data.
For coordinates, I used 33.4735 N, 82.0105 W, which is near Bush Airfield in downtown. And for the dates, I selected from January 1, 2024 to July 14, 2026, when I did the analysis.
For each day, I pulled three numbers: the high, the low, and the average temperature, all in Fahrenheit. That gave me a little over 900 days of weather — two and a half years of Augusta doing its thing. I saved it all to a CSV so I wouldn’t have to keep bothering the API every time I re-ran my code.
Making It a Fair Fight
Here’s the tricky part. We are still in July, hence the data is complete. So if I just compared whole years, 2026 would look cooler for a silly reason: the hottest months hadn’t fully happened yet, and there was no fall or winter dragging the other years’ averages around either.
To keep it honest, I cut every year down to the exact same window: January 1 through July 14. Same stretch of the calendar, three years in a row. That way, if 2026 comes out cooler, it’s because the days were actually cooler, not because I was comparing half a year to a full one.
While I was at it, I decided not to trust “average” alone. Averages hide things. A summer can have a mild average and still punch you with a week of 100-degree days. So I also counted the truly hot days, the ones at or above 90, 95, and 100 degrees, for each year in that same window.
What the Numbers Say
So, was it all in my head?
Turns out, [[ it wasn’t / it kind of was — fill in after running ]]. Here’s how the three years stacked up through July 14:
| Year | Avg. High | Avg. Low | Days > 90 |
|---|---|---|---|
| 2024 | 74.8 | 54.5 | 34 |
| 2025 | 75.0 | 54.6 | 30 |
| 2026 | 74.9 | 54.6 | 24 |
Compared to the 2024–2025 average for the same dates, 2026 has been about 0.1°F cooler. The hottest single day so far this year hit 98°F, versus 99°F and 102°F the two years before.
The chart that really sold me was the day-by-day one. I plotted a smoothed line of the daily high for each year across the calendar, all stacked on top of each other.
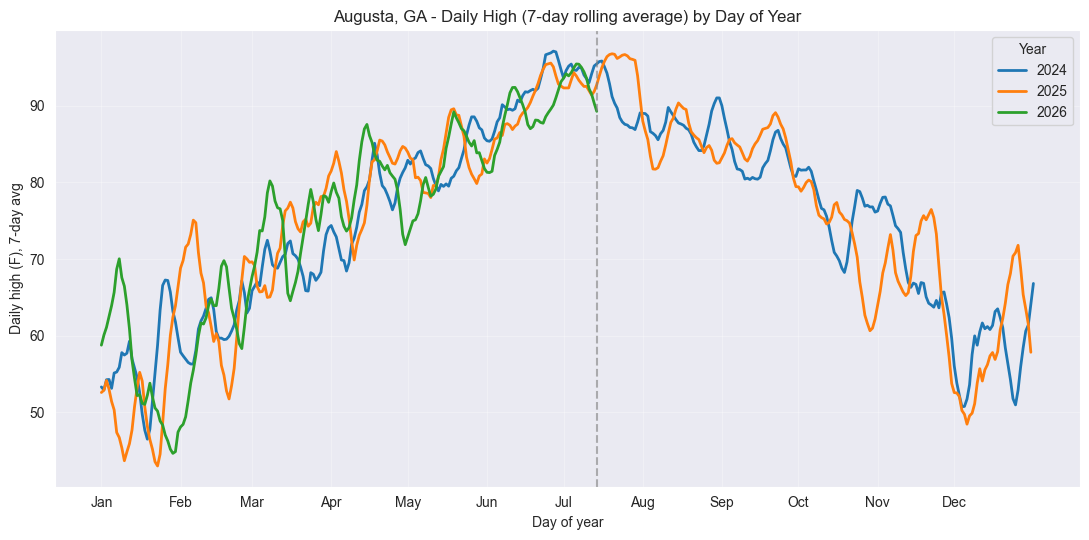
You can see the green line, that represents 2026, had a hot start in January, but then dropped and was sluggish to catch up with previous years. It also dips in March and one big one in May.
The hot-day count told the same story. This year has logged 24 days at or above 90 so far; by this point on the calendar, the last two years had already racked up over 30 hot days for the same time periodd.
So, Is It Actually Cooler?
Yes. Not by a huge margin, but enough to feel it on the porch.
It’s a real difference, but let me be fair about the size of it. We’re talking a few degrees, not a different climate. Augusta in July is still Augusta in July. But a few degrees is exactly the kind of thing you feel when you’re deciding whether to sit outside or hide by the AC, and the data backs up what my evenings had already told me.
A Few Honest Caveats
Because I can’t help myself:
The Open-Meteo numbers come from a reanalysis model, not the actual thermometer at the airport. It’s a gridded estimate, so on any given day it might be off from the official reading by a degree or two. What matters for my question is that it’s calculated the same way every year, so the comparison between years is fair even if any single day isn’t perfect.
I also only looked at one spot and one metric. I didn’t touch humidity, which, if you’ve ever spent an August here, you know is half the story. That’s another post for another day.
And of course, 2026 isn’t done. Ask me again in September and the story might change.
Back to the Porch
For now, though, I’ll take the win. The data agrees with my lawn chair: this year has been a little kinder. So if you’ve caught yourself lingering outside a few extra minutes this summer, watching the sky go orange over the Savannah, you’re not imagining it.
Enjoy it while it lasts. This is Augusta. The heat always finds its way back.
If you are into it, here is the link to my notebook on GitHub.










Comments (0)
No comments yet. Be the first to share your thoughts!
Leave a Comment